- Joined
- Dec 5, 2007
- Messages
- 1,719
- Reaction score
- 759
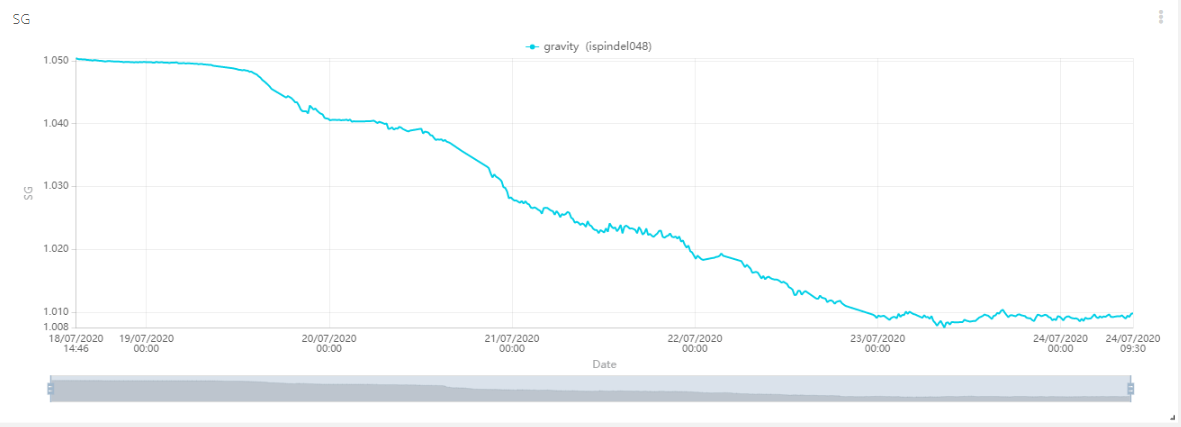
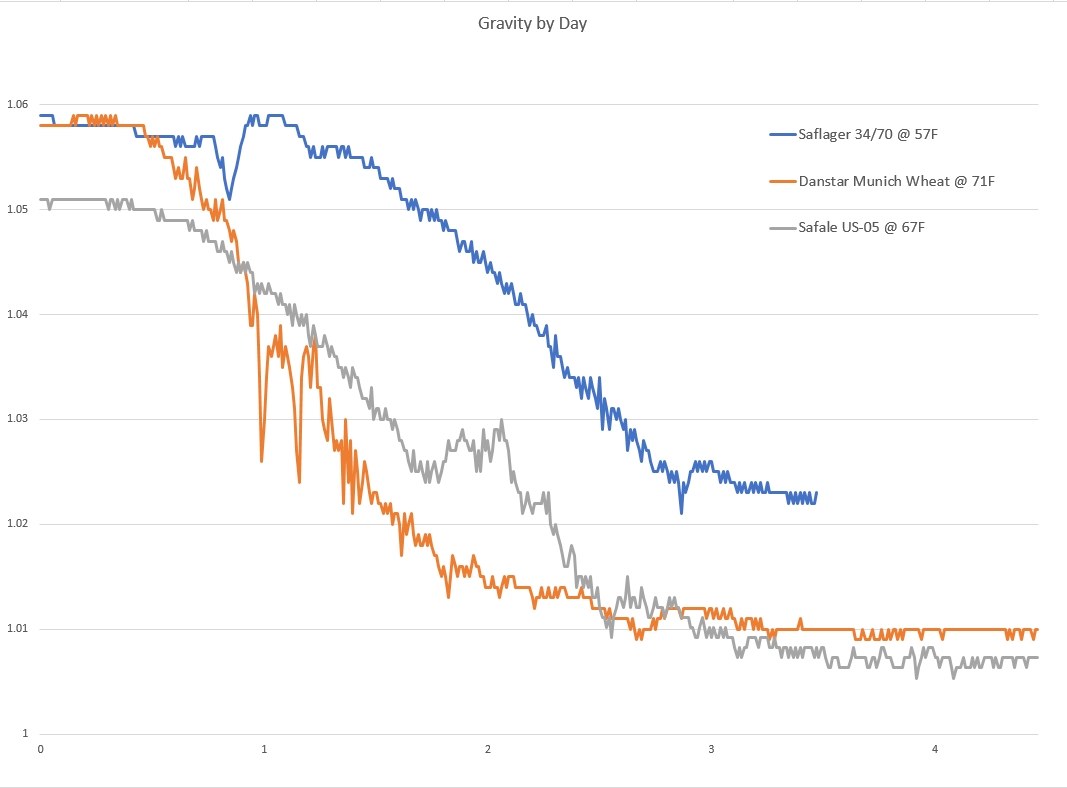
My Tilt Bluetooth hydrometer saves readings to a csv log file on a RPi running Tiltpi and I thought it might be interesting to see a cumulative chart of my last 3 10-gallon fermentations. The 34/70 was brewed Sunday so it has a ways to go but, behold for your amusement:
FWIW, the 34/70 is in a Brewing Classic Styles Vienna lager recipe except it has 80 IBU of Simcoe (so a Vienna India Pale Lager?) and I pitched 3 rehydrated packets.
The Munich Wheat was in a Dunkleweizen recipe (also from BCS), and the US-05 was in a pale ale--both were 2 packets each and pitched directly without rehydration.
All batches were aerated using a DIY Venturi aerator on the end of the tubing into the fermenter though which wort is pumped via Chugger.
The x-axis is Days if that isn't obv from the title and readings were taken every 15 minutes.
Last edited: